Engineering Insights
One of our ongoing projects is concerned with reproducing the outside world within 3D software with rich details and accurate textures. Such a product could come in handy for a visualization or a game development company, but given enough precision this could also help civil engineers and city planners — the applications are truly endless!
Project details
The primary objectives were simple enough — put together a hardware setup, strap it to a vehicle, drive around the city/countryside and map all the locations along the way.
This meant that we had to know our geolocation as well as capture the geometry and texture of the objects around us.
These requirements were covered with the following hardware:
- An IMU to provide the location on the earth’s surface and orientation
- A L.I.D.A.R to provide the geometry of everything around us
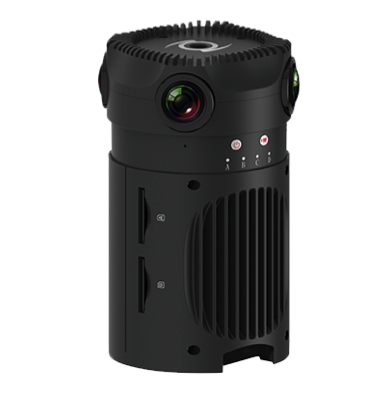
- A 360-degree camera to provide photos from the surroundings to later be used as textures
With the hardware figured out, we set out to build the software that would allow things to come together and get results from the assembled equipment and their manufacturers’ SDKs. We also had to keep in mind, when developing the software, that the hardware equipment could always change for reasons of budget or performance.
Our product’s only goal was to gather information and present it in a suitable form to a commercial tool from Bentley. Please note that we did not have to write software to do the actual texturing or mesh building.
We separated our software product into two parts — a scanning solution to be used while doing the actual mapping, and a post-processing suite of tools to merge all the data and output the final assets.
Real-time scanning
This part of the software was focused on correctly reading the data coming from the IMU, LIDAR and the 360-degree camera. The read data had to be stored in the file system without being corrupted or lost and with as little latency as possible since the gathered data would then need to be merged, and the timestamps were very important.
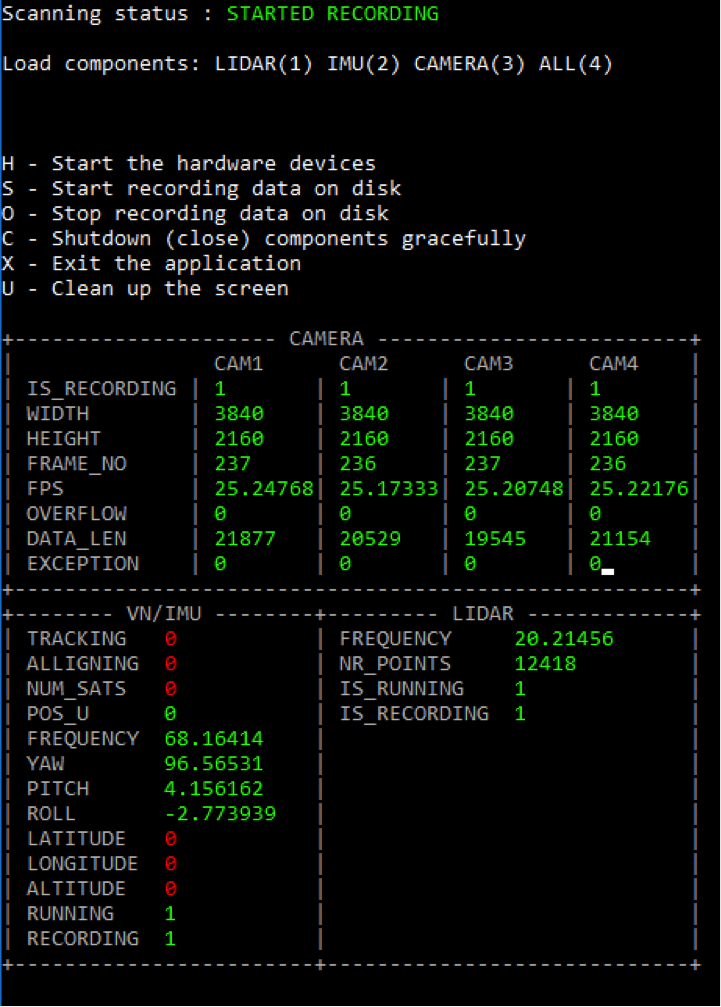
Currently, this part of the software receives commands from the console, but also can expose a REST API for any kind of GUI who offer:
- Control over when the recording starts, pauses, or stops, and where to save the data
- Information on how the hardware behaves and at what settings it runs
- Some statistics, while running the software, such as recording storage time, the current position, uncertainty, and number of locked satellites
Factors like these are important at the beginning and during the recording process so that the users can decide if they should discard the gathered data, move to another scanning location, or wait for favorable weather conditions to get a better GPS signal.
The actual data recorded inside the scanning application is:
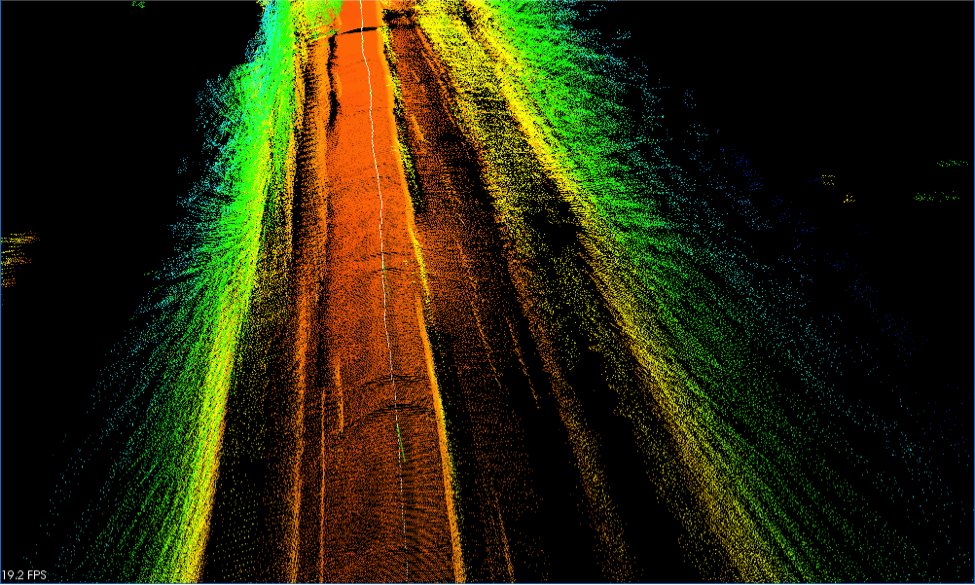
- Point cloud data files in .pcd file format for each LIDAR scan
- One trajectory file containing data from the IMU, such as timestamp, status, number of satellites, position, uncertainty, latitude, longitude, altitude, yaw, pitch, roll, directional cosine matrix, etc.
- 4 H264 video streams from the 4 cameras at 4K @30fps
Post-processing
Now that the data has been gathered, it needs to be moved from a raw state to a workable state so we can view the actual places we passed during the test drive, and have the data ready to be imported into the final software, Bentley ContextCapture Master.
The hardest part at this stage is to correctly rotate and translate the gathered point clouds. The LIDAR has its own reference axis, and so does the IMU, but the camera is not as much. Likewise, these 3 pieces of hardware are placed at a certain distance and at specific angles from each other.
All of these aspects need to be taken into account in order to make the data visible.
Here’s how it goes:
- The LIDAR points clouds need to be transformed (translated and rotated) based on the values between the IMU and the LIDAR
- Then the points need to be transformed (rotated) based on the yaw, pitch, and roll angles of the IMU at the point in time the point cloud was collected
- Then the points need to be transformed (rotated) to align the axis with the axis of the viewing window used to render the points
- Then the points need to be transformed (translated) based on the position on earth or the initial position at the start of the test drive
- Once a final point cloud is gathered it is voxelized to remove redundant data and form details.
- Afterward, another filter is applied to remove outliers.
- The resulting point cloud is then exported as a .pcd file
- This file is processed with another proprietary program to convert it into a .las file format which is supported by the Bentley software
- The camera data needs to be broken into individual frames, each frame is given a timestamp, a position, and a view angle to know from where and in which direction we took the photo
Hardware Specifications
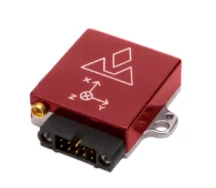
Vector Nav VN 200 has:
- Horizontal Position Accuracy of 2.5 m RMS
- Dynamic Accuracy (Pitch/Roll) of 0.1 degrees RMS – GPS Update Rate 5Hz
- Max IMU output rate 1kHz
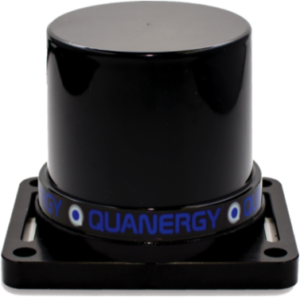
Quanergy M8 specifications:
- Minimum range 1m (80% reflectivity)
- Maximum range 150m (80% reflectivity)
- Range Accuracy (at 50 m) <3 cm
- Frame Rate (Update Frequency) 5-20 Hz
- Angular Resolution 0.03-0.2° dependent on frame rate
- Detection Layers 8
- Output Rate 420,000 points per second (1 return) 1.26M points per second (3 returns)
- Data Outputs Angle, Distance, Intensity, Synchronized Time Stamps
ZCAM S1:ZCAM
- Number of lenses/sensor modules 4
- Individual Sensor Resolution 3840×2160 @30fps / 2704×1520 @60fps – Image Sensor Sony EXMORTM CMOS Image Sensor
- Lens All glass 190o fisheye
- Video Encoder H.264
- Spherical Resolution 6K @30fps / 4K @60fps
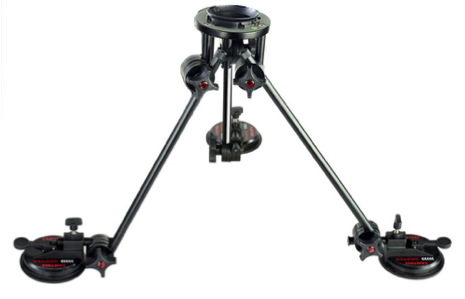
Rig:
- Compatible and customized to sustain the weight of all the hardware
- Changeable plates — this enables positioning the LIDAR at variable scanning angles
We normally tend to take on such experimental projects with a view to developing new applications that have the potential to disrupt the market and challenge the competition. It is no secret that 3D scanning and point cloud mapping have been around for quite some time, but now, with the emergence of high-performance hardware, we finally get to formulate solutions that translate into real-life utilization.
If you wish to find out more about 3D scanning, why not get in touch with us and we’ll take it from there?
